Incorporating Socratic Questioning in Investing. But Why ???

Today I am going to tell you 3 stories. Out of which 2, I heard from my IIIT professor and 1, I read in a biography book.
So here they goes:

Story 1:

A Bengali bride got married and the couple started a new journey, in a new house, in a new city. She is very good at cooking Fish (and most importantly she enjoyed it).
Fish is more or less on the menu on every alternate day. The process she normally followed is “She used to chop 2 inches each on both ends of the fish”, and put it in the micro oven. Everything was going good, until the day has come when the husband observed this peculiar behaviour and asked “WHY?”

microwave-fish

Not knowing the answer, her reply was “My mother used to do so”.

Curious hubby, called up his mother-in-law to ask the reason. But all he got was the same answer “My mother used to do so” !

Not being satisfied with the answers, he tried to contact the old lady (mother-in-law’s mother), and asked “Why did you teach your kids to chop 2 inches on both the ends of the fist while cooking in micro oven ?”

The old lady was astonished with this question and replied, “What, Are they still following it ?”

Her explanation:

There used to be no micro oven nor gas stoves in those days, and hence I had to fry the fish on pans placed on wooden fire (Primitive Cooking). The length of the pan was small and hence I had to cut 2 inches each and fry it, so that it will be evenly cooked. “But I never knew that they are still following that practise even after having micro ovens, gas stoves, and large pans”.
Story 2:

There used to be an Indian Saint who lived in the banks of Ganges river along with his disciples. The ashram was so calm & pleasant. Everything was going good, until one day a cat from some where entered the ashram and started making noise, disturbing the saint and his meditation. It also used to poop all round the ashram making it even more disgusting for the disciples to make it clean.

Frustrated with these actions, the saint ordered the disciples to “Tie the cat and put it in a basket during his meditation hours”, so that it will not disturb him during his most productive time.

Everyday just before his meditation starts, he used to asks his disciples one single question, “Had the cat tied in the basket ?”. If the answer was Yes, he used to continue with his meditation, or else it was not so good day for disciples from the saint. This continued for years together and it became a daily routine & habit of the disciples to make sure the cat is tied before saint’s meditation begins.

water-colour-painting-detailed-worshiping-india-13638699Photos-cat-sleep-in-a-basket-walls

But one fine day, the Cat died. This made the disciples furious. Being afraid of his saint, “who needs the Cat to be tied and kept in the basket”, everyday just before his meditation, all the disciples went in search of a NEW cat, bought it, tied it & kept in the basket before his saint ask for it.

(True) Story 3:

Warren in his 19, was asked by one of the then greatest traders of Wall street “Why he wants to buy GIECO ?”.
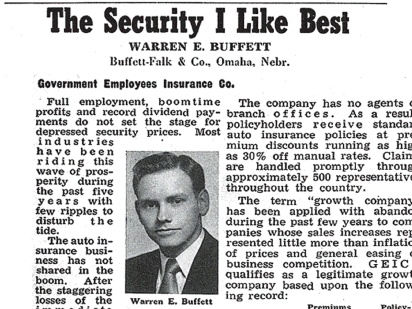
heres-20-year-old-warren-buffetts-investing-advice-from-1951

(This is image of the article which Warren wrote on GIECO during his initial days)

Warren knowing in & out of the entire company, his future potential, the scope, low cost provider which is a moat etc, kept everything in his mind and answered just one line,

“Because Graham likes it”. Of course Warren never forgot the expression given by the trader at that time.

This takes us the topic of the post “Socratic Questioning”.

Definition: Socratic questioning is disciplined questioning that can be used to pursue thought in many directions and for many purposes, including to explore complex ideas,
to get to the truth of things, to open up issues and problems, to uncover assumptions, to analyze concepts, to distinguish what we know from what we don’t know, to follow out
logical implications of thought or to control the discussion.

The key to distinguishing Socratic questioning from questioning per se is that Socratic questioning is systematic, disciplined, deep and usually focuses on fundamental concepts, principles, theories, issues or problems.

Watch this 2 min video:

Socrates was a deep thinker. He always believed that great ideas needs time & effort. If you get a great idea without critical thinking (which he states in 6 different points which we are going to discuss below),
more often than not, its not a great idea or not going to be one for long time.

So what did he say ?

1) Revealing the issue: ‘What evidence supports this idea? And what evidence is against its being true?’

Socrates asks us to search for dis-confirming evidences.

Wait a minute ? Are you thinking, what I am thinking right now ?
Yeah, you read or heard that many times. Where ? Well, our 2 Charles had spent there entire life practising this particular thought.

Charles Darwin & Charles T Munger.

They always ask us to look for dis-confirming evidence. If a particular company is destined to give good returns, spend some time negating the thought, push the thoughts to get the evidence (if any) to prove that “It will NOT give good returns this year” (Inversion).
2) Conceiving reasonable alternatives: ‘What might be another explanation or viewpoint of the situation? Why else did it happen?’

Sanjay Bakshi sir in his recent podcast with Shane Parrish of Farnam street says, he always articulate a problem by saying “The Part of the reason is…”,
meaning there are many reasons for a particular thing to happen. If we try to fix ourself with the first or second reason we think of, it is like pondering ourself to first confirmation bias and shutting off our brain to think further. In many cases is not recommeneded by these people.
3) Examining various potential consequences: ‘What are worst, best, bearable and most realistic outcomes?’

Richard Branson’s autobiography “Loosing My Virginity”, was an amazing, inspiring & roller coaster ride. In the book he says, his idea to start Virgin Airlines had became strong
only after he calculated the downside (roughly). He says, if Airlines fails all it takes is 2 quarter earnings of most successful “Virgin Records” and one year of effort.
He always insist to keep an eye on downside. Even while opening his 301th business also, he made sure that if it fails, it should not have more impact on other 300 businesses.

Isn’t this how we should learn about Portfolio Construction and practise it ?

4) Evaluate those consequences: ‘What’s the effect of thinking or believing this? What could be the effect of thinking differently and no longer holding onto this belief?’

The best thing to do is to disprove thyself. Once you found few points which contradict your initial thought process, feel happy to accept them & continue this process.

5) Distancing: ‘Imagine a specific friend/family member in the same situation or if they viewed the situation this way, what would I tell them?’

Guy pier says, he practise a strong thought process where he places himself in the shoes of Warren & Charlie in every part of his daily life. He just imagines how they both will do that thing which I am going to do now. There is no need to restrict this thought process to Investing. Infact Warren & Charlie are great investors because there were rational human beings & NOT vice versa.

Finally,

Asking these 5 Why’s, will bring us to the root cause of any problem.

Let’s try to make “Socratic Questoning” a part of our daily life & Investing practise.

Happy Learning & Investing 🙂

-END-
Portfolio allocation using Prospect Theory !!!

I first got stumbled upon the term “Prospect Theory” few years back in Daniel Kahneman’s wonderful piece of art, Thinking Fast and Slow.

It was in 1979 when Daniel Kahneman along with his colleague, the late psychologist Amos Tversky delivered a paper in Econometrica by the name “Prospect Theory: An Analysis of Decision under Risk” (here is the link for the original paper), came up with the concept of Prospect Theory also called as “Loss-aversion theory”.

Definition:
Prospect theory says that, people value gains and losses differently and, as such, will base decisions on perceived gains rather than perceived losses. Thus, if a person were given two equal choices, one expressed in terms of possible gains and the other in possible losses, people would choose the former.

For example, what do you prefer ?

1) Toss a coin. Heads, you win $100 and if it is tails, you win nothing (in other words, “you loose nothing”. Framing of words do matter).

2) Get a $46 for sure.

Here, I am not trying to figure out the most rational or advantageous choice, but just to find the intuitive choice.

Please watch this video:

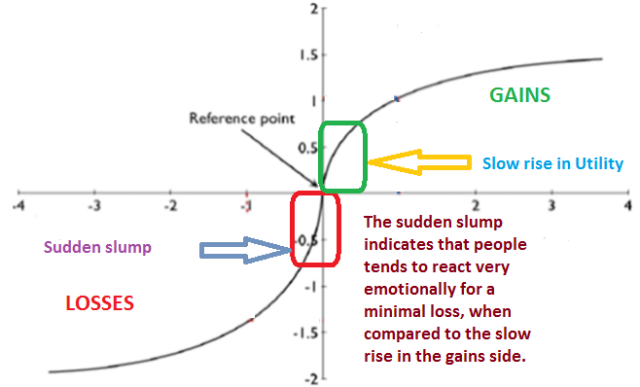
Following graph explains the Prospect Theory and lets try to understand the graph in detail:

Graph

Reference Point: From what point, do I estimate gains and losses ? It is physiological and is subjective to manipulation. It is not necessary to be a Zero in value (Premiums paid in Option pricing is a perfect example of reference points)

BTW, the entire Insurance Industry works on the emotional & financial aspects dealing with the small red box in the above graph.

Prospect Theory also talks about “Decision Weights” which says:

“Prospect theory also differs from traditional economics in the way it handles the probabilities attached to particular outcomes. Classical utility theory assumes that decision makers value a 50% chance of winning as exactly that: a 50% chance of winning. In contrast, prospect theory treats preferences as a function of “decision weights” which do not always correspond to probabilities.”

It actually postulates that human beings tend to overweight small probabilities and under react to moderate and high probabilities.

For all investors, following aspects will be considered consciously or subconsciously during their portfolio selection and weightage allocation.

a) The risks and uncertainties of the company.
b) When investors are “motivated” to see things positively about the company (WYSIATI principle: What You See Is All That Is)
c) Analysing the short-term vs long-term story of the companies and many more…

Now coming to the portfolio allocation part of it, many people knowingly or unknowingly will follow the Prospect theory in practise while building there portfolios in risk mitigation methods. Meaning, they are applying Decision Weights proposed by Kahneman.

How ? Lets see my own Portfolio strategy which I follow (or at least try to follow) most of the times:

Portfolio

As many of you, I was also immensely benefited from Value Pickr forum and above strategy is just one of many things I learnt from the collective learning that happened in that amazing website.

So if you observe, What was I doing ?

I was estimating different weightages and using them to evaluate a range of probable gains.

I was unknowingly applying “Decision Weights” much before even I know the concept of Prospect Theory (this concept happened to me at much later stage of my investment journey).

I may be wrong in the strategy which I am currently following, but what ever the new strategy I pick tomorrow, it will for sure follow the concept of Prospect Theory.

Strategies Change, Theories Evolve !!!

Happy Learning & Happy Investing 🙂

-END-
Applying probabilistic view under certain & uncertain times of Investing !!!

I am posting this after a long time and my apologizes for that. Before starting anything, my sincere thanks to Pattu sir, Ashal Jauhari ji and to AIFW for constant encouragement and support.

Now lets see what we are going to discuss today:

The more I try to understand Nassim Taleb, the more I mould myself to see this world in a probabilistic view.

Do you think assigning probability to real time world helps ? I am not sure, I am still exploring myself.

BTW, if there is one person whom I consider as the father of probability after Blaise Pascal, Girolamo Cardano is Taleb himself.

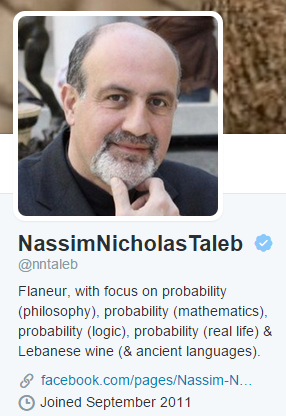
See how he describes himself in his Twitter account:

Taleb

Today, lets try to understand 2 examples (a combination of Game Theory & Probability) and how it helps us to view our investments in that direction.

(I pick this examples from various book and the source is mentioned below in Reference section. I highly recommend you to read those books)

Example 1:

How many times have you heard these comments from people ?

1) I bought Lovable Lingerie / Maxwell industries thinking this will be the next Page Industries ?
2) I bought Mastek and Mphasis as they can be the future Infosys ?
3) Granules India is the next Aurobindo pharma and I bought it.

But, do we have a reason behind these decisions, rationally or psychologically ? Yes !!!

I want all of you on a Game, Choose the best option between these 2 ?

ipod 1

Some may prefer A for its greater storage while other may prefer B for its lower price.

Now let’s add a new MP3 player to our pricing table. MP3 Player C is more expensive than both A and B and has more storage than B but less than A.

ipod image

The addition of “Option C”, which consumers would presumably avoid, given that a lower price can be paid for a model with more storage, selects A, the dominating option, to be chosen more often than if there are only two choices in Consideration.

Because A is better than C in both respects, while B is only partially better than C.

Why this has happened ? The answer lies in what we call “Decoy effect”.

Decoy Effect: The decoy effect (or asymmetric dominance effect) is the phenomenon whereby consumers will tend to have a specific change in preference between two options when also presented with a third option that is asymmetrically dominated.

For investors who had missed the ride of Page industries, they try to think to find an “alternate” that will give them the same kind of returns.

And this is how the process starts in general. Comparing Page Industries with one of its compitetors.

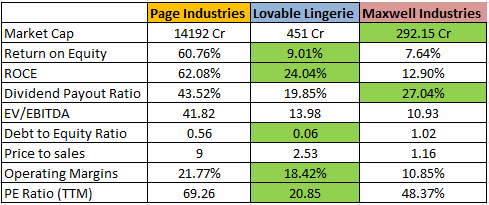
Here I am comparing Page with Lovable Lingerie

pagevslovable

So people who missed Page industries in their search for “Similar”, found the Lovable. But still are not sure whether to proceed further of not ?

Now comes another option, (Option C into picture), Maxwell Industries and compare Lovable vs Maxwell.

pagevsmaxwell

We can see that Lovable looks comparatively better than Maxwell and their are high chances we end up buying Lovable.

What had just happened ?

We started our search to find “Next Page Industries” BECAUSE it is highly valued by the market.

Remember Peter Lynch rule ?, “Always the Next of something, fails more often”

We convinced our-self saying, “since the First player in the sector did well and Third player is not doing well, Second player may do well”.

The probability of Second player amazingly increased, when third player comes into picture.

It is this thought process that will push us to buy the non performing companies and get stuck with them in our portfolios. So next time if someone says, I bought this because it is going to Next of that!, in your mind, remember it is called “Decoy Effect” 🙂
Example 2:

Understanding the importance of Conditional probability in real life: Consider this,

Suppose there are three cards. One card is red on both sides (call it RR), one is white on both sides (call it WW), and one has a side of each color (call it RW or WR).

One card is chosen at random (i.e. blindly out of a bag) and put it on table. You are able to see that one side of the card is red.  What is the probability that the other side of the card is also red?

Answer is simple right, 0.5 !!!

Because, the card is definetly not WW, so it is either RR or RW. Since it was drawn randomly, these cards are equi-probable and hence 0.5.

Is it ? Think again !!!

Clearly all red (RR) is twice likely to show a red face up as a card that only has one red side. Hence, the actual probability is 2/3 🙂

Moving on… Recently I was looking into a Pharma company (no names taken please and yes trying to understand Pharma as I realized how much I missed ignoring this wealth creating sector), and had seen the Conditional probability scenario in its business.

They are having the highest API (Active Pharmaceutical Ingredients) installed capacity in the world. Also they are into PFI (Pharmaceutical Formulation Intermediates) and FD (Finished dosages) as well.

API is the low margin product (high single digit to low double digit).
PFI magins are little higher compared to API’s but less than FD’s (somewhere b/w 15%-20%, based on the scale & operating costs).
Finished Dosages is the sweet spot of this Pharma company with margins above 20%.

Good thing is this company is trying to move above the value chain, it started purely as a API player now ventured into FD space.

But here is the catch,

API capacity is fully utilized. PFI capacity is 70% utilized and Finished Dosages is 50% utilized.

According to the recent con call, the management said, in order to increase the production of FD’s (to its full capacity, also remember this is the sweet spot of the company with highest margins), they have to increase PFI capacity, which will only happen after increasing API capacity (low margin product).

In other words, untill you spend your money (at a greater speed) on low margin products, you can’t get the fruits of high margin products (at a later period of time and mainly at a slow pace)

Now lets take the numbers:

Assume, the probability of this company utilizing the new capacity of API to the fullest : 90% (as already said, since this company is a leader in API, this will not be a problem)

Now the probability of utilizing the new capacity of PFI to the fullest : 80%

And probability of utilizing the existing capacity of Finished Dosages to the fullest: 60% (please note: this company now itself is highly under utilizing FD capactity with only 50%)

Now, since these events are dependent on each other and happens only on particular “Conditions” executed in a particular order (API->PFI->FD),

Probability of Finished Dosages product having complete utilization is = 0.9 * 0.8 * 0.6 = 0.43%

This dramatically decreases the probability of final outcome which we are looking for 😦

So these are the two examples for this post. Some may say that these are quite commonsensical in nature. Yes, I do agree. Also, every common sense / rational approach will have a behavioral and psychological theory associated with it.

If we can try to understand the meaning of our actions like what is driving us to do that & the theory behind it (instead of just focusing on the mere outcomes), our life looks much more interesting. I assure you that !!!

Happy Investing & more importantly, Happy Learning 🙂

-END-

References & Recommendations:

Thinking fast & Slow by Daniel Kahneman
Predictably Irrational by Dan Ariely
Cognitive Psychology: Mind and Brain by Smith Edward
Fooled by randomness by Nassim Taleb

How to Calculate Value At Risk for your favorite stock ?

This is a little detailed post. Please get your coffee before moving forward 🙂

What is the most I can lose on this investment? This is a question that almost every investor who has invested or is considering investing in a risky asset asks at some point in time. Value at Risk tries to provide an answer, at least within a reasonable bound. In fact, it is misleading to consider Value at Risk (or VaR as it is widely known), to be an alternative to risk adjusted value and probabilistic approaches.

How much Loss can I take ?

5

So, lets try to understand the basics of it and see how we can calculate VaR for any of our favorite stock with an Example using Excel sheet.

What is VaR or Value at risk?
VaR is a technique to probabilistically calculate the market risk of an investment or a basket (portfolio) of investments.  It uses historical values of security’s trend and volatility do determine the potential loss that a security or portfolio can witness for a particular time frame (daily, weekly or monthly) at a certain confidence level. Remember VaR is used to calculate market risk and is only valid for securities which face market risk per se. It is important to note that it is a statistical tool and only helps estimate the potential risk of an investment. The actual loss may exceed under drastic circumstances which may not be considered in the historical data used.

For stock investments, this can include situations like damage to important assets of the company, a lawsuit filed or lost etc. However, such situations can be assumed to be improbable and can be neglected.

What is confidence level?
In a general concept, it is a statistically used number used for forecasting.
Generally confidence level is used at 95% or 99% which means that these percentage of times (of the period), the loss will not exceed the VaR. For example, if monthly VaR in percentage terms for a security A is -20% at 99% confidence level,  it means that the security A can be expected to return at least -20% return (or higher) in a month 99% of the times for the entire holding period.
There is only 1% probability that it will fall more than 20%.

Who uses VaR analysis?

Every major player in the Financial world !!!

8 7 and Many more…

VaR is used by banks, hedge funds, mutual funds, derivatives traders, pension funds and other trading organizations. It can be used by small retail investors or retail wealth managers as well; who are planning for future wealth requirements (financial goals).  It is suggested that any investment made for a period of more than 6 months should be considered for VaR analysis.

How is VaR calculated?
There are various methods to calculate VaR. However there are three widely used methods:
1. Historical returns method
2. Variance-Covariance method
3. Monte Carlo simulation
For retail investors and traders like us, we can use historical returns method which is fairly simple to use and calculate.
Variance-Covariance method can also be used and it is a quicker way to calculate VaR.

As usual, I know neither me nor you are interested in only theory part of it. Lets dive into the numbers & practical use of it using Historical returns method.

This is a crude way to calculate VaR (mainly for retial investors like us). If you want to learn more about How banks and Large financial institutions  calculate VaR. You can start from here http://tinyurl.com/mf5v3hh

Here is a step by step process to calculate VaR using Historical returns method:

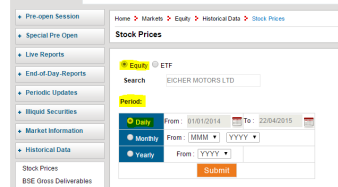
Step 1: Open http://www.bseindia.com and navigate through Markets -> Historical Data
OR click directly on http://www.bseindia.com/markets/equity/EQReports/StockPrcHistori.aspx?expandable=7&flag=0

1

Step 2: Select the stock for which you want to know the VaR. Also select daily, monthly or yearly interval data.  So if you want to calculate daily value at risk, you can download daily period data.
If you want to know monthly VaR then download monthly. For daily, a period of historical data for one year or more should suffice.  For monthly VaR, download at least past 3 years’ data.
Remember, longer the historical data period more accurate will be the statistical calculations.
This calculation assumes that the historical data has a normal distribution. A larger data set would make this assumption valid. Hence, the more historical data you use, the better result it gives.

4

Step 3: Click on the Download option given below in CSV/XLS file format.
We only need the Day/Month column & Closing price column. Hence Hide all the other unnecessary columns like Open Price, No.of Shares, Deliverables etc.

Step 4: Filter the Date/Month column from Ascending to Decending order.
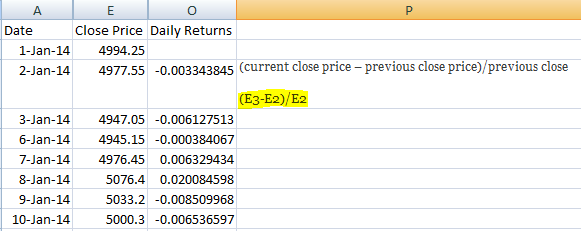
And Starting from second day/month row, we calculate the return since the last period (day or month).
(current close price – previous close price)/previous close.

Before moving forward understand this following statistical function:

NORMINV (p, µ, sigma):

The Excel NORMINV function calculates the “Inverse of the Cumulative Normal Distribution Function” for a supplied value of x, and a supplied distribution mean & standard deviation.

The format of the function is :

NORMINV( probability, mean, standard_dev )

probability – The value at which you want to evaluate the inverse function
mean – The arithmetic mean of the distribution
standard_dev – The standard deviation of the distribution

Step 5: 

2

Step 6:

3

Kindly do understand that this is a theoretical approach and markets are NOT bound to follow then. In practice there are many days where Eicher motors stock was down by more points than what we have derived at. Here we have to consider the Time frame (which is one of our parameter in calculating VaR). So over a period of time T, we are 95% sure that the stock price will not go beyond -468 points (again, this conclusion in completely theoretical and acting on this is sure shot way for disaster)

Also remember VaR calculation is not to understand the risk of downside of a script. Imagine if you have take a Short position on a stock. What if the stock price goes towards North.
Hence in general Risk means not the only downside moment of the stock price. But it should be considered from the perceptive of your current portfolio position.

-END-

The day I met the Prof !!!

Firstly, sorry for long gap from my previous post. It was unintentional and happened because of my hectic project work with my new company.

Now, this post is about my experience of meeting my Guru (Prof. Sanjay Bakshi), To all the readers of this post, their is no need to introduce this legend.

This is how it all happened…

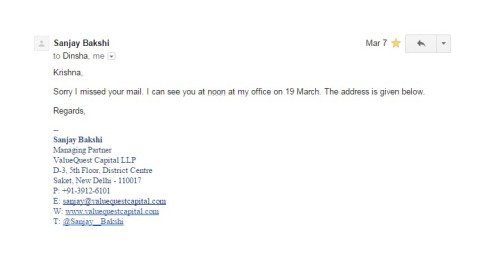
During February 2015, one of my holding Eicher Motors had released a notification saying that its AGM was going to happen on 20th March 2015. The first thought that came to my mind is if I go to Delhi, I may also get an opportunity to meet Bakshi sir. Without second thought I requested Bakshi sir on his FB page. He is very kind enough to accept my request immediately.

Bakshi sir mail

Later, all I have done is to just wait for the day.

I bought two books (which are his favourites) Influence and Fooled by Randomness, to get it signed from him.

Finally the day has arrived, I reached Delhi on 19th March morning. I had a pre-booked room. After fresh-up, without any delay I got the Metro from New Delhi Railway station to reach Saket.

Below is his office building (pic taken from Google). I reached the office on time and contacted the security guys, who in turn contacted Value Quest Capital.

sanjay sir office

Bakshi sir was in a meeting at that time, and I had waited for around 15 minutes in his waiting room.

In the room I just wanted to get as much information as I can get from the room. I have seen 2 news papers Business Standard and Economic Times. The Economist magazine. TV which is currently off and a nice painting on the back side. The ambiance was amazing.

Finally the moment has come. There he was, Bakshi sir. As an instant reaction, I touched his feet out of respect.

He made me comfortable and asked me about my qualification, current Job etc.

And this was my first question to him.

Me) Sir, what are the 3 qualities that made you where you are now ? In other words, what 3 qualities you suggest to a budding investor like me ?

Bakshi sir)

1) Krishna, you have to be extremely passionate, curious to learn. Money will follow later. Always ask WHY, WHY & WHY ? You may not get answer for everything, but that is how
we learn. Learn from people who established great businesses over a period of time. Read MD&A reports of them. For example, read MD&A reports of Sun Pharma. Dilip Sanghvi is a visionary, learn how he envisioned it and achieved it, slowly and steadily, year or year, he created an Empire. Understand how those people made it BIG.

2) You should have Role models. Not just the Good ones, but also the bad ones. You must know how to be and more importantly How NOT to be ?
For example, Nassim Taleb (pointing out to my book, Fooled by Randomness on the table), is a very arrogant guy. You can get the sense from his tweets. But, I like the way he thinks. He is an extreme thinker, I like it and take that from him. Have role models and work, dream to be as them one day. Have multi-disciplinary thinking like Charlie Munger.

3) Be a voracious reader. And switch off that Idiot box (pointing out to the TV in the room). Just watch a cricket match or something once in a while. That’s it. It is of zero use. It takes a life time to write a book and we have to respect it and dedicate enough time for it daily. There are enormous learning in books.
As Mark Twain says, “The man who does not read has no advantage over the man who cannot read.” You must know what to read and what not to. There is not point in reading news paper end to end. Most of it is of irrelevant (at this instance I remembered Nassim Taleb’s Noise vs Signal discussion in my subconscious mind). Clearly differentiate Good reads and bad reads. Buffett reads 500 pages every day. That’s how knowledge builds like a snow ball over a period of time.

Me) Thanks a lot sir, what are the books you suggest for any investor to reach next level in Investment world. I know you always suggest to start from BH annual letters, but apart from that can you suggest some books ?

Bakshi sir) Read all Pat Dorsey, Stephen Penman, Michael E. Porter books. All these are great collections in their respective fields and helps to make you understand deeper in the world of Investing.

Me) Thanks a lot for your encouraging words sir. This will be the most memorable day for me.

Bakshi sir) Its OK. Just one second, I will be back.

(After 2 min…)

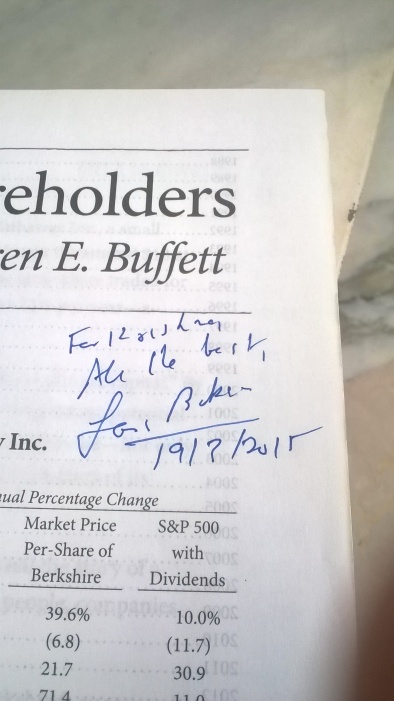
I was stunned with his Gift. He bought a signed copy of Berkshire Hathaway Annual letters book (1965-2012), which will cost around Rs 4500/- in India (http://goo.gl/Xn1yVy).

Me) Sir, this is very costly sir.

Bakshi sir) No problem Krishna. I give it usually to my students. All the very best for your future.

Me) Sir, I am not sure how you felt when you received a signed copy of Poor Charlie Almanack from Charlie himself. But this moment is much more than that for me sir.
I am speechless currently by your kindness and encouragement.

With a heart full of Joy, enthusiasm, memories and a strong motivation, I came out of his office.

This small meeting of around 10 minutes had given me immense confidence and enormous encouragement. Thanks again to Bakshi sir for giving me most memorable moments.

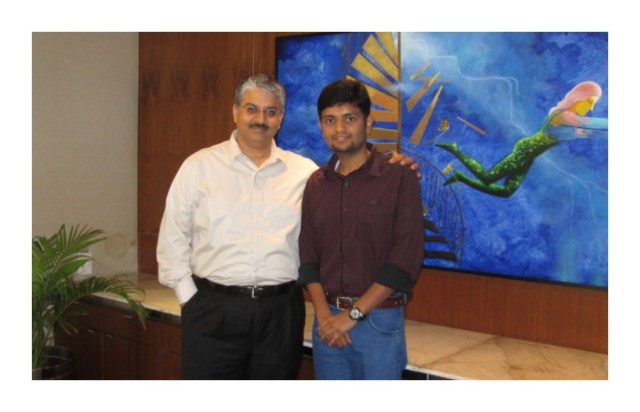
Here are the pics, I took with him…

Meeting Bakshi sir WP_20150319_007 WP_20150319_008

WP_20150319_003 WP_20150319_009

-The END-

Why do second runners outperform the leaders in Bull markets ?

In one of the videos of Basant Maheswari sir (here), he pointed out that “Second runner stocks will outperform the market leaders till the Bull market is in full force, And if you want to buy them you should be smart enough to exactly know the exit point”

In this post, lets not only try look at those numbers, but also will try to find the reasoning of such behavior.

This can be explained by using any sector, but I have chosen to go with Commodity space because of the variety of complexities this sector brings with it conventional thinking doesn’t hold good here.

For example:

a) If you are thinking of applying conventional parameters like good management, efficiently run, healthy balance sheet, less debt and manageable interest burden
to value a commodity stock, you are in for big surprise.

b) These companies are subjected to commodity cycles. Moreover, the commodity companies have varying capital structure (we will look into it in a short while)

So let’s get started:

In a commodity bull market, when commodity prices start moving up the trend is reflected in the working results of the leaders. The leaders are well run companies having a healthy balance sheet and a reasonable market share. Due to their market position they command a good respect and are tracked by many brokerage houses and analysts. When the leaders start doing well. the laggards also attract the attention from the investors, as they are perceived to be able to deliver good results in the view of hardening commodity prices.

At this point of time, investors do not see if the company is good or bad, but will buy it and the reasoning they give is “Arey yaar pura sector upar chal raha hai. Why to pay high for leader ? Get the second runner for cheap”. One in-built attribute of commodity companies is the “Low cost producer with good management on its side will do good”.

Rising tide effect:

A rising tide lifts everybody. A six foot father with his three foot son in the water would go up with the tide. How ever, the son’s rise will be far more significant that the father’s,  because the starting point is half of his father. This is be also explained by Low base effect.

Low base effect:

It is much easy to improve margins from 5% to 10% (100% Jump) than from 20% to 40% (the same 100% Jump). This is called Low base effect. “This is where the laggards score over the leaders”.  Investors are thus more excited with the laggards as they seem to be performing better than the leaders. This makes the stock go up much better and faster resulting in good good results for the investors.

It will be more important to invest in the best, i.e the Market leader especially for commodity investing. This has many advantages in the form of Scale and Size, Less debt, pricing power and the ability to with stand the downturns. In bad times such companies are able to survive for long term and thus survive for longer periods of business cycles.

Okey. Enough of gyaan. Show me the numbers Krishna !!!

Yes, here it is.

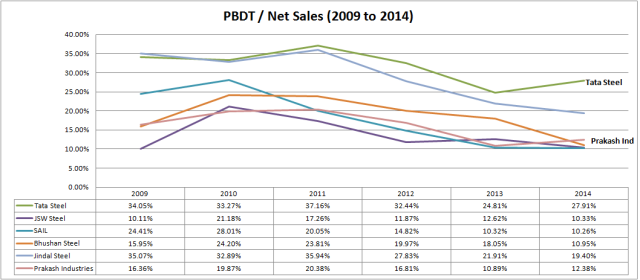
For this purpose I would like to evaluate the profitability analysis with the ratio PBDT to Net Sales to examine the financial result of selected steel industries in India. This analysis give us result of profitability with reference to study period from 2003-08 to 2009-14. Generally PBDT / Net sales is used in comparing investment opportunities with in industry.

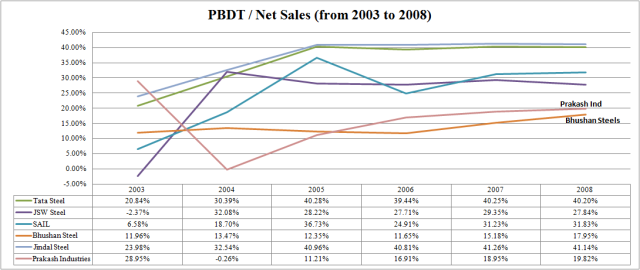
Firstly below graph depicts the PBDT / Net sales ratio from 2003 to 2008 (Previous Bull run).

PBDT 2003 to 2008

Few Observations from this graph:

a) During 2003 to 2008, Tata Steel and Jindal Steel had the highest PBDT / Net Sales ratio compared to all other companies.
b) Prakash Industries and Bhushan Steels under performed (in terms of profitability) compared to others.

Now what should normally happen ?

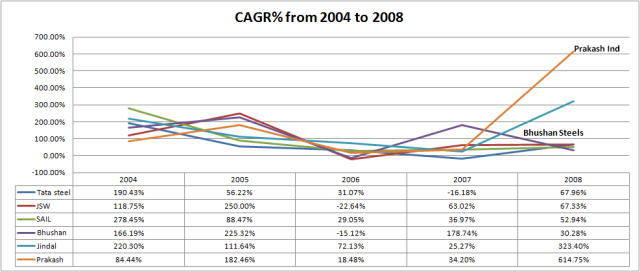
The companies with less profitability should give low returns and companies with High profitability should give High returns. Isn’t it ?

No, that’s not the case.

CAGR 2004 to 2008

What happened ?

a) Prakash Industries which is not so profitable on books during those period, given the maximum returns.
b) Followed by Jindal steel, Bhushan steel and others.

Strange right ? Not so fast. Lets see what happened when the tide turned against them.

PBDT 2009 to 2014

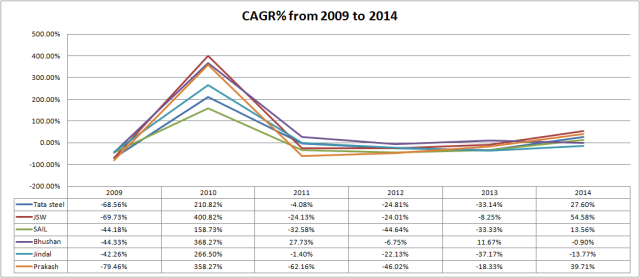
CAGR 2009 to 2014

The main thing to observe here is “Low Base effect” (as explained above) acted in favour of Prakash Industries and Bhushan steels during the bull run. Even though their profitability is less comparatively they delivered much high returns. But after 2009 every things went upside down (observe the Negative prices in above graph) and the factors that influenced the stock prices are:

a) Low cost producer.
b) Low debt companies.
c) De-rating of the companies.
d) Interest burden declines.
e) Lower Taxes
f) Capital structure of the companies etc.

2) Other very important factor that acts in favor of second runners during the bull markets is “Operating Leverage”.

Enough Krishna. Done for today, Thanks for your post and Good Bye.

Sorry to say, but without discussing Operating Leverage here, this post is not complete. I am sorry for extended post but pardon me.

What is Operating Leverage ?

Definition says, “A measurement of the degree to which a firm or project incurs a combination of fixed and variable costs”.

Watch this 2.5 minutes video from Investopedia.

How this will impact companies and makes a difference during good and bad times ?

Here is another simple example:

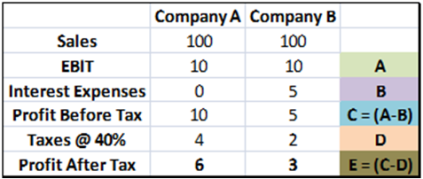
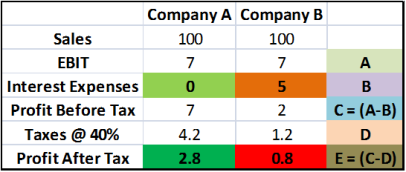
Example: Consider two companies, Company A (CMP: Rs 60/-)and Company B (CMP: Rs 10/-). They are actually into same sector and have same sales,  the same operating earnings, the same everything except that Company A has no debt and Company B has a debt at a 10 percent interest rate.  (All numbers are per share basis).

In first scenario, lets consider both the companies are growing.

Scenario 1

Now the PE of Company A is (assuming EPS is 6): 60 / 6 = 10 PE.
PE of company B is (assuming EPS of 3): 10 / 3 = 3.33 PE
Company A’s PAT is 100% greater than Company B. So which is CHEAP among A & B ?

Simple answer Company B is cheap right ?

Now look here, Assume the growth has been hampered and EBIT fell from 10 to 7 this year. Tax remains same.

Scenario 2

Company B has to pay the same interest of Rs 5/- even in low growth times, where as company A can simply hand over its profits to share holders.  Now Company A’s PAT is 350% greater than Company B (Initially it was just 100% greater than Company A). This explains that, Laggards will

Finally, for mediocre business all the factors like Low base effect, Operating Leverage, Cheap valuations, Carry forward of losses etc looks in their favor during good times. But we need to differentiate between good, bad and ugly businesses. “Because in Bull markets even Donkeys look and behave like Horses.”

Happy New year and have a Great year ahead. Happy Investing 🙂

-END-
Why Price to Book (P/BV) ratio is important in valuing banks ?

In our recent AIFW Investors meet happened in Bangalore on 14th Dec 2014, one friend asked me why do we look at PBV ratio for banks much before any other ratio ? Hence I thought of writing a post explaining the reason behind that valuation metric.

Yes, that’s true that Equity analyists while analysing bank stocks emphasize their valuation more on PBV (Price to Book value). Reason ?

Before answering it. Firstly, lets try to understand what is unique about Financial service firms ?

Financial service firms have much in common with non-financial service firms. They also try to be as profitable as they can, they also worry about competition and want to grow rapidly over time. They are also judged by the total return they make for their stockholders. But the main problem comes in this aspect.

Is DEBT a Raw material or Source of Capital for the banks ?

Debt-for-Canadians    images  imagesCA8EIPB7

Any company can raise the capital by using 2 ways, Debt (bond holders) and Equity (shareholders).
When we value the firm, we value the value of the assets owned by the firm, rather than just the value of its equity. But when coming to a Financial Firm, debt seems to considered as a different aspect. “Rather than view debt as a source of capital, most financial service firms seem to view it as a raw material.”

In other words, debt is to a bank what steel is to Tata Motors (a Raw material). Treat is as a raw material that something to be molded into other products which can then be sold at a higher price and yield a profit.

For example, should deposits made by customers into their checking accounts at a bank be treated as debt by that bank? Especially on interest-bearing checking accounts, there is little distinction between deposits and debt issued by the bank. If we do categorize this as debt, the operating income for a bank should be measured prior to interest paid, which would be problematic since interest expenses are usually the biggest single expense item for a bank.

Usually, P/BV figures for companies in the services industries like software and FMCG are high as
compared to those of companies in the sectors like auto, engineering, steel and banking. This is due to sectors such as software and FMCG have low amount of tangible assets (fixed assets etc.) on their books and therefore, the P/BV may not be a correct indicator of valuation.

On the other hand, capital intensive businesses such as auto and engineering require large balance sheets, i.e., they have a large amount of fixed assets and investments. P/BV is a good indicator of measuring value of stocks from such capital intensive sectors.

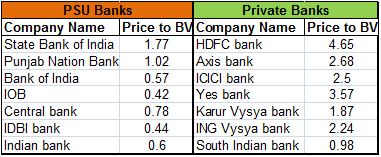
If a company is trading at a P/BV of less than 1, this indicates that the company is earning a poor return on its assets (ROA). NPA’s are the major concern for all the PSU banks becuase of the same reason, all these banks trade at PBV ratio less than 1.

The below image compares the PSU banks (high NPA’s) w.r.t to Private banks (Low NPA’s) and their relative PBV valuations.
pbv

What does P/BV fail to indicate?

P/BV indicates the inherent value of a company and is a measure of the price that investors are ready to pay for a ‘nil’ growth of the company. As such, since companies in the services sectors like software and FMCG have a high growth component attached to them, Price to Earnings ratio (P/E Ratio) would be a better method of gauging valuations.

The ratio has its shortcomings that investors need to recognise. However, it offers an easy-to-use tool for identifying clearly under or overvalued companies.

-END-
Unfolding the Multi-folds. How multibaggers happen ?

Please NOTE: This post is not to discuss”How to create Multibaggers ?”, but to understand how does it happen and how does it unfolds during that time.

Most of the investors who come to stock market have one thing in common. They dream to have a few multibaggers in his/her portfolio. Nothing wrong in that, but the problem comes if he doesn’t know how it works.

The curiosity to understand how few things teaches a lot. And that undying quality of the investor is his strength.

Now lets try to unfold how multi-folds happen.

Their are mainly two types of multibaggers that happen:

1) Steady compounding machines: These companies usually are sector leaders and are compounding machines (read my previous article here). They compound for decades together (due to their inbuilt Longevity nature) and create HUGE wealth for share holders.

Few Examples:

HDFC Bank: It had its IPO in March 1995 and till date it has multiplied 1000 times. If you have few hundred shares of HDFC Bank during its IPO, you will be sitting next to Sanjoy Bhattacharya and Raamdev Agrawal during the investors meets.

Asian Paints: This company came public in 1982 and have give around 2400 times till date (adjusted for splits & bonuses).

ITC: In 1988, the total market cap of the entire company is just 110 crores (meaning, with just 1.1 crore you can buy 1% of this debt free company). Now, the total market cap of the company is 2 Lacs 92 thousand crores (Just imagine about those 1% if you have own, now turned to 2920 crores excluding dividends).

The list never ends.

2) The Newbies, fast runners and turnarounds:

This is the interesting part of the story. Multibaggers that happen in this category create HUGE wealth within short period of time. And most investors look for this category only.

Example:

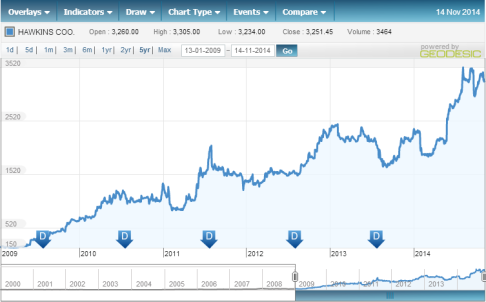
Hawkins Cookers: A CAGR of 84% in the last 5 years. If someone invested 1Lac in 2009, now he will be sitting a cashpile of about 21 Lacs.

Hawkins

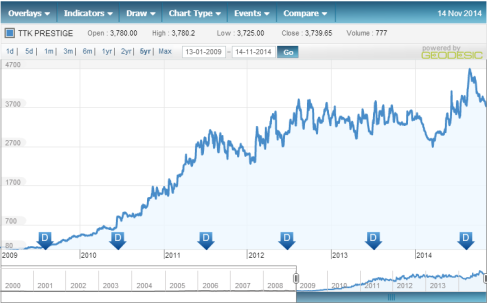
TTK Prestige: Returned a CAGR of close to 90% from 2009. Here 1Lac might have turned into 35 Lacs.

TTK

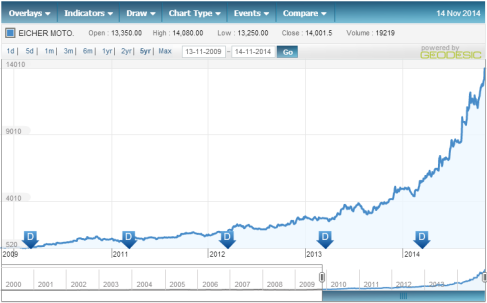
Eicher Motors: CAGR of around 87% in the last 5 years and still running fast.

Eicher

The list also includes few other gems like Page Industries, Astral Polytec, Titan Industries, Crisil, Mayur Uniquoters, Cera sanitaryware, Kajaria ceramics, La Opala etc.

So, what made these stocks to give those spectacular returns in such a short span of time ?

What is the difference between Category 1 and Category 2 ?

Before answering that, lets understand this:

Their are 2 factors by which the stock prices move upward/downwards, PE and EPS.

EPS gives the earnings of the company per share. In most of the cases these earnings are real (this may not apply for Infra companies, Real estate company, Companies whose management is a crook and some times even for 20th or 25th company is a sector which is in bubble. Example: Penta media soft, DSQ software during 2000)

Now PE is nothing but the sentiment of the investors community (this includes everyone, Trader, Speculator, Bull Operator, Bear Operator, Algorithmic trader, and a dull and boring investor like me).
Technically, PE means “How many rupees you are willing to pay for a single rupee of earnings”. This gives the PE.

For example, Asian paints PE is 54 (or put it in another words, Asian paints is trading at 54 times earnings). This means the investors community is willing to pay 54 rupees for every single rupee that he is going to get from Asian paints on yearly basis.

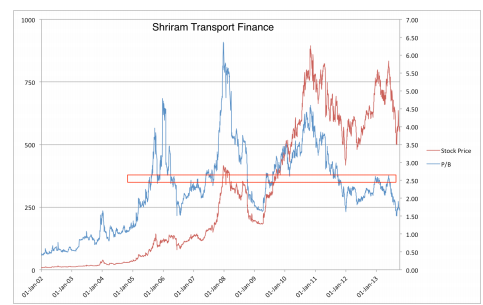
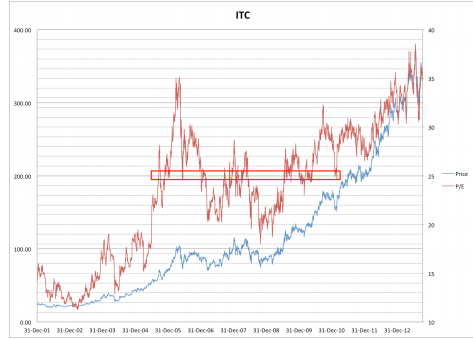
Below graph shows that how PE moved with respect to its Price for ITC and Shriram transport.

ITC

Sriram

Images source: http://fundooprofessor.wordpress.com/

The unexpected interest of a company among the investors makes the PE to expand in short period of time. First of its kind company in a new sector enjoy this benefit.

1) Bharti Airtel: It was an emerging company in an emerging sector in 2003. Initially people didn’t understand the true potential of the company. Veterans like Raamdev Agrawal, Basant Maheswari had a vision to see the next 5 years of the company and made a killing out of it. During those days, Bharti Airtel used to trade at a single digit PE. In the next 5 years, PE expanded to around 80 times and made it a potential multibagger in just 5 years.

2) Page Industries traded at a PE of 22 in 2008 and it expanded upto 55 times in the span of 6 years and currently trading at around 55 times.

3) TTK Prestige PE expanded from 12 to 40 in 5 years.

Now what do we understand ?

Multibaggers of category 1 happen:

When their is longevity of Earnings. In other words, these companies continue to deliver for years together and their “Earnings” increase with very little movement in “PE” of those stocks. These companies usually take decade or two to multiply 50, 100 times with very less risk to the portfolio.

Asian Paints, HDFC bank, ITC, Nestle etc always traded at premium PE’s because of the trust on its Earnings. (Some exceptions are incidents like 2008 crisis where these companies are available at throw away PE’s)

Multibaggers of category 2 happens mainly because of PE Expansion:

It can happen some where or the other sector in every bull run:

IT in 1997-2000,
Infra in 2003-2007,
Consumer durables 2007-2013,
Semi-Urban and Rural housing (as expecting by many): Currently.

It can even happen on company basis (first time companies in that sector) on both bull and bear periods:

Airtel 2002-2007,
Pantaloons 2002-2008,
Eicher Motors 2009-Till date.

Krisha enough of Gyaan. Show me the NUMBERS !!!

Yes, even I too love numbers. Lets jump into it.

PE Expansion:

Initially, the stock remains unrecognized. Therefore the PE multiple is less then the growth rate. Usually here, even though the company is
growing, market does not believe the growth that the company is experiencing.

Let us assume that a company with a growth of 30% is given a multiple of 10 for an EPS of Rs 10. The market price is Rs 100.

PE_Ex_1

After one year, earnings rise to 13 (10 + 30%). Investors started believing in the company and its earnings. As the stock gains recognition and more coverage it starts getting a higher multiple of say 30 times.
This makes the market price of the company to go to 13*30 = Rs 390/-

PE_Ex_2

See, even though there is no absolute increase in the company’s earnings. Just because the investors have recognized the true potential of its earnings, its price moved up 4 times in just one year.

This is just half of the story !!!

PE Expansion will make you RICH and at the same time PE Contraction will cut off the neck unknowingly.

PE Contraction: 

The heights of Infosys stock price in 2000’s weren’t reached till 2006-2007. The peak of Bharti Airtel (574 in 2007) haven’t met till date and is currently trading at 392 (as of Nov 17th 2014).

Why & How ?

Lets take the same example:

Once the stock has been recognized and the market convinced about the growth rates the PE multiples move ahead of the growth rates.  For instance during the 2000 technology boom Infosys was valued at more than 100 times its earnings since the company was delivering a growth of 100% year after year.

PE_Co_1

Let us assume that in the example given above the company’s growth rates tapers off to a more realistic 15%.
These changes in growth rates do not happen year on year but still the market responds to this change earlier
then they are out in the public domain because of this the PE multiple of the company will contract

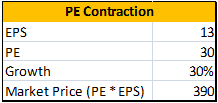
PE_Co_2

See what made the price to move from 100 to 390 in one year and the same price to move back to 160 in next year.

Many times, the company in category 2 moves to category 1. If it doesn’t then it will be part of a next coming bubble, be prepared.

If you understand this, then next time you can classify why a company price is increasing and on what basis ?

So, tomorrow morning you go to office and check you portfolio as part of your daily routine and see the price movements. If it is NOT an earnings season, make sure you keep a close eye on PE expansion and PE contraction of your stock.

Finally, “PE expansion is like a pinch hitter in the cricket XI it makes a quick fire 40 in 25 balls but expecting it to make another 40 in the next 25 balls is difficult.”

END

Sources:

Theequitydesk.com

Motilal Oswal wealth creation reports

DuPoint Analysis – The True ROE

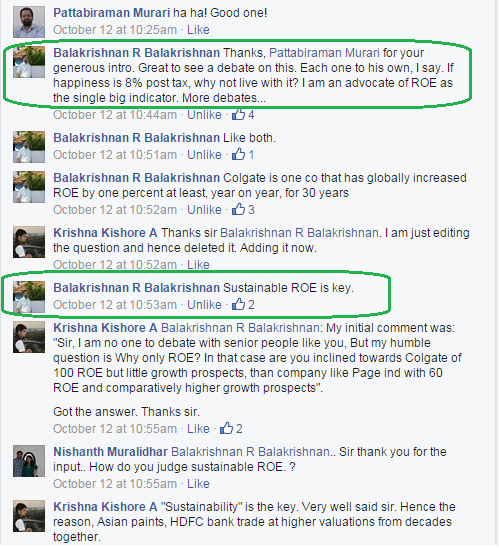
Few days back in our Facebook group AIFW, we had a nice discussion on importance of ROE and one of the big heads in banking and financial services Mr. Balakrishnan R Balakrishnan Sir of Moneylife shared his views on it (He blogs at http://goo.gl/pJmOC6).

Following is the screen shot.

FB Comment


Now lets try to dig deep and understand the True ROE via DuPoint Analysis.

(Continue reading…)