This is a little detailed post. Please get your coffee before moving forward 🙂
What is the most I can lose on this investment? This is a question that almost every investor who has invested or is considering investing in a risky asset asks at some point in time. Value at Risk tries to provide an answer, at least within a reasonable bound. In fact, it is misleading to consider Value at Risk (or VaR as it is widely known), to be an alternative to risk adjusted value and probabilistic approaches.
How much Loss can I take ?

So, lets try to understand the basics of it and see how we can calculate VaR for any of our favorite stock with an Example using Excel sheet.
What is VaR or Value at risk?
VaR is a technique to probabilistically calculate the market risk of an investment or a basket (portfolio) of investments. It uses historical values of security’s trend and volatility do determine the potential loss that a security or portfolio can witness for a particular time frame (daily, weekly or monthly) at a certain confidence level. Remember VaR is used to calculate market risk and is only valid for securities which face market risk per se. It is important to note that it is a statistical tool and only helps estimate the potential risk of an investment. The actual loss may exceed under drastic circumstances which may not be considered in the historical data used.
For stock investments, this can include situations like damage to important assets of the company, a lawsuit filed or lost etc. However, such situations can be assumed to be improbable and can be neglected.
What is confidence level?
In a general concept, it is a statistically used number used for forecasting.
Generally confidence level is used at 95% or 99% which means that these percentage of times (of the period), the loss will not exceed the VaR. For example, if monthly VaR in percentage terms for a security A is -20% at 99% confidence level, it means that the security A can be expected to return at least -20% return (or higher) in a month 99% of the times for the entire holding period.
There is only 1% probability that it will fall more than 20%.
Who uses VaR analysis?
Every major player in the Financial world !!!

 and Many more…
VaR is used by banks, hedge funds, mutual funds, derivatives traders, pension funds and other trading organizations. It can be used by small retail investors or retail wealth managers as well; who are planning for future wealth requirements (financial goals). It is suggested that any investment made for a period of more than 6 months should be considered for VaR analysis.
How is VaR calculated?
There are various methods to calculate VaR. However there are three widely used methods:
1. Historical returns method
2. Variance-Covariance method
3. Monte Carlo simulation
For retail investors and traders like us, we can use historical returns method which is fairly simple to use and calculate.
Variance-Covariance method can also be used and it is a quicker way to calculate VaR.
As usual, I know neither me nor you are interested in only theory part of it. Lets dive into the numbers & practical use of it using Historical returns method.
This is a crude way to calculate VaR (mainly for retial investors like us). If you want to learn more about How banks and Large financial institutions calculate VaR. You can start from here http://tinyurl.com/mf5v3hh
Here is a step by step process to calculate VaR using Historical returns method:
Step 1: Open http://www.bseindia.com and navigate through Markets -> Historical Data
OR click directly on http://www.bseindia.com/markets/equity/EQReports/StockPrcHistori.aspx?expandable=7&flag=0

Step 2: Select the stock for which you want to know the VaR. Also select daily, monthly or yearly interval data. So if you want to calculate daily value at risk, you can download daily period data.
If you want to know monthly VaR then download monthly. For daily, a period of historical data for one year or more should suffice. For monthly VaR, download at least past 3 years’ data.
Remember, longer the historical data period more accurate will be the statistical calculations.
This calculation assumes that the historical data has a normal distribution. A larger data set would make this assumption valid. Hence, the more historical data you use, the better result it gives.

Step 3: Click on the Download option given below in CSV/XLS file format.
We only need the Day/Month column & Closing price column. Hence Hide all the other unnecessary columns like Open Price, No.of Shares, Deliverables etc.
Step 4: Filter the Date/Month column from Ascending to Decending order.
And Starting from second day/month row, we calculate the return since the last period (day or month).
(current close price – previous close price)/previous close.
Before moving forward understand this following statistical function:
NORMINV (p, µ, sigma):
The Excel NORMINV function calculates the “Inverse of the Cumulative Normal Distribution Function” for a supplied value of x, and a supplied distribution mean & standard deviation.
The format of the function is :
NORMINV( probability, mean, standard_dev )
probability – The value at which you want to evaluate the inverse function
mean – The arithmetic mean of the distribution
standard_dev – The standard deviation of the distribution
Step 5:

Step 6:
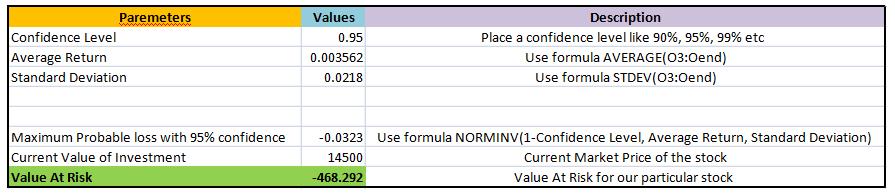
Kindly do understand that this is a theoretical approach and markets are NOT bound to follow then. In practice there are many days where Eicher motors stock was down by more points than what we have derived at. Here we have to consider the Time frame (which is one of our parameter in calculating VaR). So over a period of time T, we are 95% sure that the stock price will not go beyond -468 points (again, this conclusion in completely theoretical and acting on this is sure shot way for disaster)
Also remember VaR calculation is not to understand the risk of downside of a script. Imagine if you have take a Short position on a stock. What if the stock price goes towards North.
Hence in general Risk means not the only downside moment of the stock price. But it should be considered from the perceptive of your current portfolio position.
-END-

Thanks for bringing in a new concept which is very much informative and in a understandable way. I will explore this and try to check for the stocks in my PF.
LikeLiked by 1 person
Thanks Fasil.
LikeLike
Krishna.. after a long time seeing your post.
Thanks for the post.
It would be helpful if you can upload the excel sheets that you have used for some your stocks.
LikeLike
[…] more risks. They were lulled into a sense of security by a fact that their Value at Risk models (Read this post by Krishna over at Tyroinvestor for an explanation of how VaR works) told them it would take a ten sigma event for the firm to lose all its capital, a probability they […]
LikeLike