Portfolio allocation using Prospect Theory !!!

I first got stumbled upon the term “Prospect Theory” few years back in Daniel Kahneman’s wonderful piece of art, Thinking Fast and Slow.

It was in 1979 when Daniel Kahneman along with his colleague, the late psychologist Amos Tversky delivered a paper in Econometrica by the name “Prospect Theory: An Analysis of Decision under Risk” (here is the link for the original paper), came up with the concept of Prospect Theory also called as “Loss-aversion theory”.

Definition:
Prospect theory says that, people value gains and losses differently and, as such, will base decisions on perceived gains rather than perceived losses. Thus, if a person were given two equal choices, one expressed in terms of possible gains and the other in possible losses, people would choose the former.

For example, what do you prefer ?

1) Toss a coin. Heads, you win $100 and if it is tails, you win nothing (in other words, “you loose nothing”. Framing of words do matter).

2) Get a $46 for sure.

Here, I am not trying to figure out the most rational or advantageous choice, but just to find the intuitive choice.

Please watch this video:

Following graph explains the Prospect Theory and lets try to understand the graph in detail:

Graph

Reference Point: From what point, do I estimate gains and losses ? It is physiological and is subjective to manipulation. It is not necessary to be a Zero in value (Premiums paid in Option pricing is a perfect example of reference points)

BTW, the entire Insurance Industry works on the emotional & financial aspects dealing with the small red box in the above graph.

Prospect Theory also talks about “Decision Weights” which says:

“Prospect theory also differs from traditional economics in the way it handles the probabilities attached to particular outcomes. Classical utility theory assumes that decision makers value a 50% chance of winning as exactly that: a 50% chance of winning. In contrast, prospect theory treats preferences as a function of “decision weights” which do not always correspond to probabilities.”

It actually postulates that human beings tend to overweight small probabilities and under react to moderate and high probabilities.

For all investors, following aspects will be considered consciously or subconsciously during their portfolio selection and weightage allocation.

a) The risks and uncertainties of the company.
b) When investors are “motivated” to see things positively about the company (WYSIATI principle: What You See Is All That Is)
c) Analysing the short-term vs long-term story of the companies and many more…

Now coming to the portfolio allocation part of it, many people knowingly or unknowingly will follow the Prospect theory in practise while building there portfolios in risk mitigation methods. Meaning, they are applying Decision Weights proposed by Kahneman.

How ? Lets see my own Portfolio strategy which I follow (or at least try to follow) most of the times:

Portfolio

As many of you, I was also immensely benefited from Value Pickr forum and above strategy is just one of many things I learnt from the collective learning that happened in that amazing website.

So if you observe, What was I doing ?

I was estimating different weightages and using them to evaluate a range of probable gains.

I was unknowingly applying “Decision Weights” much before even I know the concept of Prospect Theory (this concept happened to me at much later stage of my investment journey).

I may be wrong in the strategy which I am currently following, but what ever the new strategy I pick tomorrow, it will for sure follow the concept of Prospect Theory.

Strategies Change, Theories Evolve !!!

Happy Learning & Happy Investing 🙂

-END-

Applying probabilistic view under certain & uncertain times of Investing !!!

I am posting this after a long time and my apologizes for that. Before starting anything, my sincere thanks to Pattu sir, Ashal Jauhari ji and to AIFW for constant encouragement and support.

Now lets see what we are going to discuss today:

The more I try to understand Nassim Taleb, the more I mould myself to see this world in a probabilistic view.

Do you think assigning probability to real time world helps ? I am not sure, I am still exploring myself.

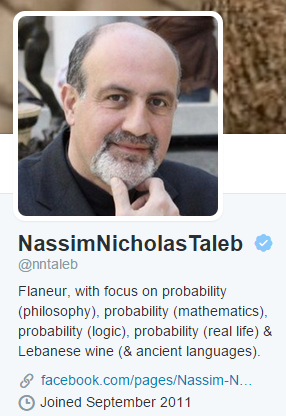
BTW, if there is one person whom I consider as the father of probability after Blaise Pascal, Girolamo Cardano is Taleb himself.

See how he describes himself in his Twitter account:

Taleb

Today, lets try to understand 2 examples (a combination of Game Theory & Probability) and how it helps us to view our investments in that direction.

(I pick this examples from various book and the source is mentioned below in Reference section. I highly recommend you to read those books)

Example 1:

How many times have you heard these comments from people ?

1) I bought Lovable Lingerie / Maxwell industries thinking this will be the next Page Industries ?
2) I bought Mastek and Mphasis as they can be the future Infosys ?
3) Granules India is the next Aurobindo pharma and I bought it.

But, do we have a reason behind these decisions, rationally or psychologically ? Yes !!!

I want all of you on a Game, Choose the best option between these 2 ?

ipod 1

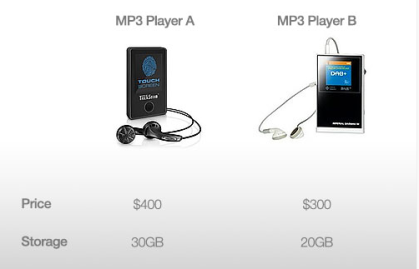
Some may prefer A for its greater storage while other may prefer B for its lower price.

Now let’s add a new MP3 player to our pricing table. MP3 Player C is more expensive than both A and B and has more storage than B but less than A.

ipod image

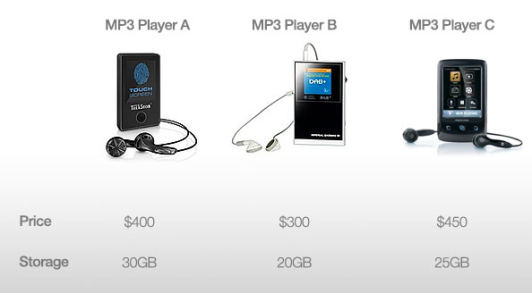
The addition of “Option C”, which consumers would presumably avoid, given that a lower price can be paid for a model with more storage, selects A, the dominating option, to be chosen more often than if there are only two choices in Consideration.

Because A is better than C in both respects, while B is only partially better than C.

Why this has happened ? The answer lies in what we call “Decoy effect”.

Decoy Effect: The decoy effect (or asymmetric dominance effect) is the phenomenon whereby consumers will tend to have a specific change in preference between two options when also presented with a third option that is asymmetrically dominated.

For investors who had missed the ride of Page industries, they try to think to find an “alternate” that will give them the same kind of returns.

And this is how the process starts in general. Comparing Page Industries with one of its compitetors.

Here I am comparing Page with Lovable Lingerie

pagevslovable

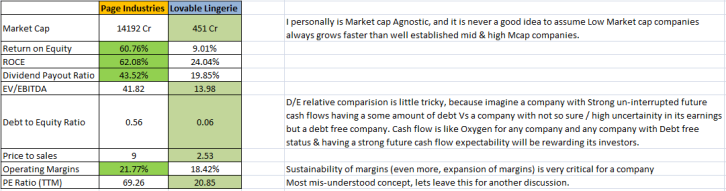
So people who missed Page industries in their search for “Similar”, found the Lovable. But still are not sure whether to proceed further of not ?

Now comes another option, (Option C into picture), Maxwell Industries and compare Lovable vs Maxwell.

pagevsmaxwell

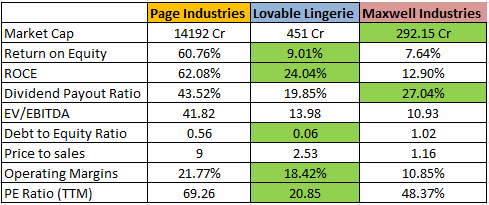
We can see that Lovable looks comparatively better than Maxwell and their are high chances we end up buying Lovable.

What had just happened ?

We started our search to find “Next Page Industries” BECAUSE it is highly valued by the market.

Remember Peter Lynch rule ?, “Always the Next of something, fails more often”

We convinced our-self saying, “since the First player in the sector did well and Third player is not doing well, Second player may do well”.

The probability of Second player amazingly increased, when third player comes into picture.

It is this thought process that will push us to buy the non performing companies and get stuck with them in our portfolios. So next time if someone says, I bought this because it is going to Next of that!, in your mind, remember it is called “Decoy Effect” 🙂
Example 2:

Understanding the importance of Conditional probability in real life: Consider this,

Suppose there are three cards. One card is red on both sides (call it RR), one is white on both sides (call it WW), and one has a side of each color (call it RW or WR).

One card is chosen at random (i.e. blindly out of a bag) and put it on table. You are able to see that one side of the card is red.  What is the probability that the other side of the card is also red?

Answer is simple right, 0.5 !!!

Because, the card is definetly not WW, so it is either RR or RW. Since it was drawn randomly, these cards are equi-probable and hence 0.5.

Is it ? Think again !!!

Clearly all red (RR) is twice likely to show a red face up as a card that only has one red side. Hence, the actual probability is 2/3 🙂

Moving on… Recently I was looking into a Pharma company (no names taken please and yes trying to understand Pharma as I realized how much I missed ignoring this wealth creating sector), and had seen the Conditional probability scenario in its business.

They are having the highest API (Active Pharmaceutical Ingredients) installed capacity in the world. Also they are into PFI (Pharmaceutical Formulation Intermediates) and FD (Finished dosages) as well.

API is the low margin product (high single digit to low double digit).
PFI magins are little higher compared to API’s but less than FD’s (somewhere b/w 15%-20%, based on the scale & operating costs).
Finished Dosages is the sweet spot of this Pharma company with margins above 20%.

Good thing is this company is trying to move above the value chain, it started purely as a API player now ventured into FD space.

But here is the catch,

API capacity is fully utilized. PFI capacity is 70% utilized and Finished Dosages is 50% utilized.

According to the recent con call, the management said, in order to increase the production of FD’s (to its full capacity, also remember this is the sweet spot of the company with highest margins), they have to increase PFI capacity, which will only happen after increasing API capacity (low margin product).

In other words, untill you spend your money (at a greater speed) on low margin products, you can’t get the fruits of high margin products (at a later period of time and mainly at a slow pace)

Now lets take the numbers:

Assume, the probability of this company utilizing the new capacity of API to the fullest : 90% (as already said, since this company is a leader in API, this will not be a problem)

Now the probability of utilizing the new capacity of PFI to the fullest : 80%

And probability of utilizing the existing capacity of Finished Dosages to the fullest: 60% (please note: this company now itself is highly under utilizing FD capactity with only 50%)

Now, since these events are dependent on each other and happens only on particular “Conditions” executed in a particular order (API->PFI->FD),

Probability of Finished Dosages product having complete utilization is = 0.9 * 0.8 * 0.6 = 0.43%

This dramatically decreases the probability of final outcome which we are looking for 😦

So these are the two examples for this post. Some may say that these are quite commonsensical in nature. Yes, I do agree. Also, every common sense / rational approach will have a behavioral and psychological theory associated with it.

If we can try to understand the meaning of our actions like what is driving us to do that & the theory behind it (instead of just focusing on the mere outcomes), our life looks much more interesting. I assure you that !!!

Happy Investing & more importantly, Happy Learning 🙂

-END-

References & Recommendations:

Thinking fast & Slow by Daniel Kahneman
Predictably Irrational by Dan Ariely
Cognitive Psychology: Mind and Brain by Smith Edward
Fooled by randomness by Nassim Taleb

How to value cyclical companies ?

Starting from this, I want to make a series of posts on different valuation techniques we use to value the companies like,

1) Young companies
2) Growth companies
3) Mature companies
4) Cyclical companies
5) Commodity based companies
6) Declying companies etc

In my previous post I have already discussed, how differently we value Financial firms.

In this post, I am going to discuss on how to value cyclical company by taking Maruthi Suzuki as example.

Uncertainty and volatility are endemic to valuation, but cyclical and commodity companies have volatility thrust upon them by external factors. As a consequence, even mature companies have volatile earnings and cash flows.

It is always a challenge to value companies that have volatile earnings. (Continue reading…)

My monkey’s portfolio experiment !!!

Few days back I read an article which says about an experiment conducted at City University London (view the report here), where a group of monkeys (not the original monkeys but computer programmed) were given the task to choose couple of stocks and built a portfolio. Then they back tracked them to check how they performed vis-a-vis the market.

Inspired by this idea, I had conducted the same experiment on Indian stock markets. (Continue reading…)

How little we know?

That was exactly my feeling after reading some of the facts in the past few days which I am going to discuss below.

The heading of this post have 2 meanings:

1) How much as an individual I know?

2) How much as a retail investor community WE know compared to big players out there?

Companies, Promoters, Brokers, Auditors, Institutional investors etc, all these people have only one thing in their mind apart from making profit. It is to use every opportunity to take the money out from Retail investors pockets. (Not all companies, but most of them). This greedy nature of companies combined with the pressure to stay top in the competition allows them to do such things. They make use of every option they have, to show us that their books are stronger than actual. (Continue reading…)

What is the Piotroski score of your stock ?

In fundamental analysis, no single tool or ratio will give the complete picture of the stock. Let it be P/E, EPS, D/E etc, all these ratios must be considered together to get the overall financial health of the company. In today’s post let’s know about something called “Piotroski score” which gives a number using fundamental analysis. What is this number and how it must be used? Let’s see below:

Joseph Piotroski, an American professor of Accounting at Stanford University. He rose to fame by his most influential 2000 paper he wrote at University of Chicago titled “Value Investing: The Use of Historical Financial Statement Information to Separate Winners from Losers” (Click here link for the full report) (Continue reading…)

How to differentiate between Moats and Hawa Mahals ?

For most of us, it’s common sense to pay more for something that is more durable. From kitchen appliances to cars to houses, items that will last longer are typically able to command higher prices, because the higher up-front cost will be offset by a few more years of use. Hero Motor corp bikes costs more than TVS bikes, Asian paints costs more than Berger paints and so forth.

The same concept applies to the stock market. Durable companies that is, companies that have strong competitive advantages are more valuable than companies that are at risk of going from hero to zero in a matter of months because they never had much of an advantage over their competition.

What is an Economic moat?

“The idea of an economic moat refers to how likely a company is able to keep competitors at bay for an extended period. One of the keys to finding superior long-term investments is buying companies that will be able to stay one step ahead of their competitors.” (Continue reading…)

Equity Valuation using Discounted Cash Flow method !!!

In the previous post we discussed Equity Valuation using Price Multiple method and now let’s try to discuss one of the most important and widely used method to calculate intrinsic value of a stock.

We all hear phrases like “Cash is the King”, “Show me the Money” etc.  all these tends to one simple rule of Valuation technique.

I am quoting here one of my favorite quotes of Aswath Damodaran:

“Value of an asset is not what someone perceives it to be worth, but it is a function of the expected cash flows on that asset.” (Continue reading…)

Compounding Machines in Indian Stock Market

Investing in equity is not so much about knowing market lows and peaks, rather it is about identifying potential wealth creators and backing on them for years.

As many of the investment community (including most of us) believes that we are at the start of bull market (Ramesh Damani went one step ahead and stated “We are already at the end of Phase 1 and moving to Phase 2 of bull market”), what should be our approach ? (Continue reading…)