In one of the videos of Basant Maheswari sir (here), he pointed out that “Second runner stocks will outperform the market leaders till the Bull market is in full force, And if you want to buy them you should be smart enough to exactly know the exit point”
In this post, lets not only try look at those numbers, but also will try to find the reasoning of such behavior.
This can be explained by using any sector, but I have chosen to go with Commodity space because of the variety of complexities this sector brings with it conventional thinking doesn’t hold good here.
For example:
a) If you are thinking of applying conventional parameters like good management, efficiently run, healthy balance sheet, less debt and manageable interest burden
to value a commodity stock, you are in for big surprise.
b) These companies are subjected to commodity cycles. Moreover, the commodity companies have varying capital structure (we will look into it in a short while)
So let’s get started:
In a commodity bull market, when commodity prices start moving up the trend is reflected in the working results of the leaders. The leaders are well run companies having a healthy balance sheet and a reasonable market share. Due to their market position they command a good respect and are tracked by many brokerage houses and analysts. When the leaders start doing well. the laggards also attract the attention from the investors, as they are perceived to be able to deliver good results in the view of hardening commodity prices.
At this point of time, investors do not see if the company is good or bad, but will buy it and the reasoning they give is “Arey yaar pura sector upar chal raha hai. Why to pay high for leader ? Get the second runner for cheap”. One in-built attribute of commodity companies is the “Low cost producer with good management on its side will do good”.
Rising tide effect:
A rising tide lifts everybody. A six foot father with his three foot son in the water would go up with the tide. How ever, the son’s rise will be far more significant that the father’s, because the starting point is half of his father. This is be also explained by Low base effect.
Low base effect:
It is much easy to improve margins from 5% to 10% (100% Jump) than from 20% to 40% (the same 100% Jump). This is called Low base effect. “This is where the laggards score over the leaders”. Investors are thus more excited with the laggards as they seem to be performing better than the leaders. This makes the stock go up much better and faster resulting in good good results for the investors.
It will be more important to invest in the best, i.e the Market leader especially for commodity investing. This has many advantages in the form of Scale and Size, Less debt, pricing power and the ability to with stand the downturns. In bad times such companies are able to survive for long term and thus survive for longer periods of business cycles.
Okey. Enough of gyaan. Show me the numbers Krishna !!!
Yes, here it is.
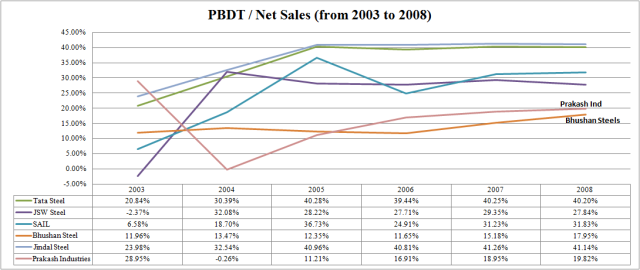
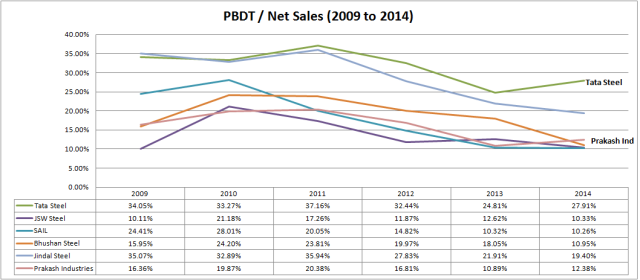
For this purpose I would like to evaluate the profitability analysis with the ratio PBDT to Net Sales to examine the financial result of selected steel industries in India. This analysis give us result of profitability with reference to study period from 2003-08 to 2009-14. Generally PBDT / Net sales is used in comparing investment opportunities with in industry.
Firstly below graph depicts the PBDT / Net sales ratio from 2003 to 2008 (Previous Bull run).
Few Observations from this graph:
a) During 2003 to 2008, Tata Steel and Jindal Steel had the highest PBDT / Net Sales ratio compared to all other companies.
b) Prakash Industries and Bhushan Steels under performed (in terms of profitability) compared to others.
Now what should normally happen ?
The companies with less profitability should give low returns and companies with High profitability should give High returns. Isn’t it ?
No, that’s not the case.
What happened ?
a) Prakash Industries which is not so profitable on books during those period, given the maximum returns.
b) Followed by Jindal steel, Bhushan steel and others.
Strange right ? Not so fast. Lets see what happened when the tide turned against them.
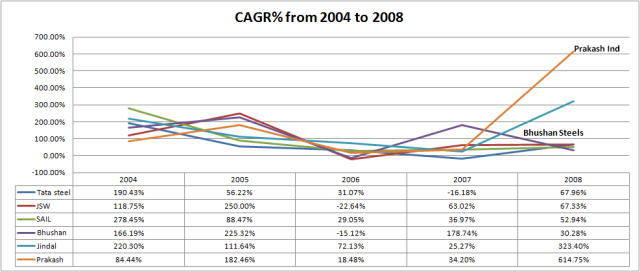
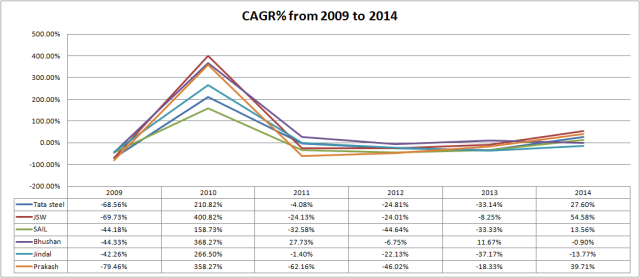
The main thing to observe here is “Low Base effect” (as explained above) acted in favour of Prakash Industries and Bhushan steels during the bull run. Even though their profitability is less comparatively they delivered much high returns. But after 2009 every things went upside down (observe the Negative prices in above graph) and the factors that influenced the stock prices are:
a) Low cost producer.
b) Low debt companies.
c) De-rating of the companies.
d) Interest burden declines.
e) Lower Taxes
f) Capital structure of the companies etc.
2) Other very important factor that acts in favor of second runners during the bull markets is “Operating Leverage”.
Enough Krishna. Done for today, Thanks for your post and Good Bye.
Sorry to say, but without discussing Operating Leverage here, this post is not complete. I am sorry for extended post but pardon me.
What is Operating Leverage ?
Definition says, “A measurement of the degree to which a firm or project incurs a combination of fixed and variable costs”.
Watch this 2.5 minutes video from Investopedia.
How this will impact companies and makes a difference during good and bad times ?
Here is another simple example:
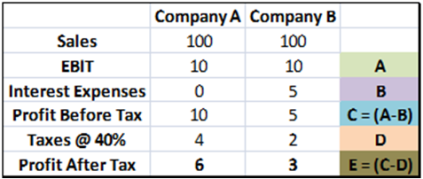
Example: Consider two companies, Company A (CMP: Rs 60/-)and Company B (CMP: Rs 10/-). They are actually into same sector and have same sales, the same operating earnings, the same everything except that Company A has no debt and Company B has a debt at a 10 percent interest rate. (All numbers are per share basis).
In first scenario, lets consider both the companies are growing.
Now the PE of Company A is (assuming EPS is 6): 60 / 6 = 10 PE.
PE of company B is (assuming EPS of 3): 10 / 3 = 3.33 PE
Company A’s PAT is 100% greater than Company B. So which is CHEAP among A & B ?
Simple answer Company B is cheap right ?
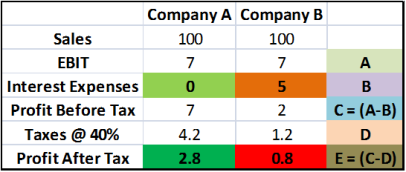
Now look here, Assume the growth has been hampered and EBIT fell from 10 to 7 this year. Tax remains same.
Company B has to pay the same interest of Rs 5/- even in low growth times, where as company A can simply hand over its profits to share holders. Now Company A’s PAT is 350% greater than Company B (Initially it was just 100% greater than Company A). This explains that, Laggards will
Finally, for mediocre business all the factors like Low base effect, Operating Leverage, Cheap valuations, Carry forward of losses etc looks in their favor during good times. But we need to differentiate between good, bad and ugly businesses. “Because in Bull markets even Donkeys look and behave like Horses.”
Happy New year and have a Great year ahead. Happy Investing 🙂
-END-
